Investment timeline analysis: Why multi-period tracking beats single snapshots
Discover how multi-period investment analysis reveals patterns and opportunities that daily portfolio checks miss. Transform your approach.

Adonia La Camera
You've probably heard the advice: "Time in the market beats timing the market." But here's what nobody tells you about that wisdom, it's not just about staying invested longer. It's about understanding how time itself shapes your investment results in ways that single snapshots never reveal. Professional portfolio tracking tools like Stock Portfolio Tracker can help you analyze these patterns, but the real insight comes from understanding how to read your investment timeline correctly.
Most investors look at their portfolios like they're checking the weather. They see today's numbers, maybe compare them to last month or last year, and think they understand their progress. But investment success isn't measured in moments. It's measured in patterns, cycles, and the rhythm of how your money grows across different market conditions.
The real question isn't whether your portfolio is up or down right now. It's whether your investment approach creates consistent value across the unpredictable seasons of market life.
The story your investment timeline tells
Every investment decision you make exists within a timeline, and that timeline holds secrets about your investing skill that daily price movements can't reveal. When you can see how your choices perform across multiple time horizons, patterns emerge that change everything about how you think about risk and return.
Consider what happens when you view the same investment across different time windows. That technology stock that seems like a disaster over the past six months might be your best performer over the past three years. Conversely, the "safe" dividend stock that's been steady lately could be underperforming when you look at longer horizons.
These insights matter because markets operate in cycles, not straight lines. Bull markets can make almost any strategy look brilliant, while bear markets expose the weaknesses in approaches that seemed foolproof. Understanding how your investments behave across these different environments is the difference between accidental success and sustainable wealth building.
Currency movements add another layer of complexity for globally diversified investors. A European stock might show modest gains in euros but significant losses in dollars, depending on the time period you examine. Without multi-period analysis, you might never realize how exchange rates are affecting your real returns.
The timing of your contributions also creates stories that single-period analysis misses entirely. Money invested just before a market peak behaves differently than money invested during a correction, even in the same underlying assets. Multi-period analysis reveals whether your investment timing and dollar-cost averaging strategies are working in your favor.
What emerges when you connect the dots across time
When you start examining your portfolio across multiple time periods simultaneously, you begin to see your investments as dynamic systems rather than static positions. This shift in perspective reveals opportunities and risks that were invisible before.
Seasonal patterns in your investment approach become apparent. You might discover that your portfolio consistently performs better in certain quarters, or that specific sectors in your holdings follow predictable cycles that you can anticipate and potentially capitalize on.
The effectiveness of your rebalancing strategy reveals itself over multiple periods. You can see whether your periodic adjustments actually improved returns or just created unnecessary transaction costs. This insight is crucial because rebalancing is often recommended as a best practice, but without multi-period analysis, you can't know if it's actually helping your specific situation.
Correlation patterns between different parts of your portfolio shift over time in ways that single-period analysis can't capture. Two investments that seem uncorrelated during calm markets might move in lockstep during stress periods. Understanding these changing relationships helps you build more robust diversification strategies.
Your ability to maintain discipline during market volatility becomes measurable. Multi-period analysis shows you whether you tend to make emotional decisions during specific types of market conditions, and whether those decisions help or hurt your long-term returns.
Breaking free from short-term thinking traps
Short-term portfolio performance can be deeply misleading, especially when it comes to evaluating the effectiveness of your investment strategy. Multi-period analysis acts as an antidote to the cognitive biases that plague investors who focus too heavily on recent results.
Recency bias makes recent performance feel more important than it actually is. A few bad months can make you question an otherwise sound long-term strategy, while a recent winning streak might give you false confidence in approaches that haven't been tested across full market cycles.
Cherry-picking favorable time periods is a common trap that multi-period analysis helps you avoid. When you examine your performance across multiple overlapping and distinct periods, you can't hide from the full truth of your investment results. This honest assessment is essential for making meaningful improvements to your approach.
The illusion of control that comes from frequent portfolio monitoring often leads to overtrading and strategy changes that hurt long-term returns. When you can see how different time horizons tell different stories about the same investments, you develop the patience necessary for successful long-term investing.
Multi-period analysis also reveals the compound effect of seemingly small differences in performance. A strategy that outperforms by just a percentage point or two annually can create dramatically different wealth outcomes over longer periods, but these differences are often invisible when you focus on short-term results.
Discovering your investment personality through time
Your multi-period investment history is like a personality test that reveals your true investing character. It shows not just what you own, but how you behave when markets test your resolve.
Some investors are natural trend followers who excel during sustained market moves but struggle during choppy, sideways markets. Others are contrarian by nature, buying during downturns and selling during euphoria. Multi-period analysis reveals which type of investor you actually are, as opposed to which type you think you are.
Your risk tolerance varies more than you might realize across different time periods and market conditions. What feels like appropriate risk during a bull market might feel terrifying during a correction. Understanding these patterns helps you build portfolios that you can actually stick with during difficult periods.
The sectors and asset classes you gravitate toward often follow patterns that become clear only through multi-period analysis. You might think you're well-diversified, but discover that you consistently overweight certain types of investments during specific market environments.
Your reaction to major market events creates a historical record that predicts how you might behave in future crises. Did you buy more during the 2020 market crash, or did you sell? How did your behavior during previous corrections affect your subsequent returns? This self-knowledge is invaluable for making better decisions going forward.
From pattern recognition to strategic advantage
The goal of multi-period analysis isn't just to understand what happened, but to use those insights to improve what happens next. When you can see the full picture of how your investments behave across time, you gain strategic advantages that single-period focused investors lack.
You can identify which of your investment strategies work best in different market environments. Maybe your value-oriented picks excel during recovery periods, while your growth investments shine during expansion phases. This knowledge allows you to adjust your approach based on current market conditions.
Timing your rebalancing activities becomes more strategic when you understand the historical patterns in your portfolio. Instead of rebalancing on arbitrary calendar dates, you can time these activities to coincide with periods when rebalancing has historically been most beneficial.
Your understanding of true diversification improves dramatically when you see how correlations between your investments change across different time periods and market conditions. This leads to more robust portfolio construction that can weather various market storms.
Cash flow planning becomes more sophisticated when you understand the seasonal and cyclical patterns in your dividend income and capital appreciation. You can better predict when your portfolio might generate the cash flows you need for major expenses or reinvestment opportunities.
Building confidence through comprehensive understanding
Investment confidence comes from knowledge, not hope. When you understand how your portfolio behaves across multiple time horizons, you develop the conviction necessary to stay invested during difficult periods and the wisdom to make adjustments when they're truly needed.
This comprehensive view helps you separate signal from noise in your investment results. Short-term volatility becomes less emotionally challenging when you can see it in the context of longer-term progress. You learn to distinguish between temporary setbacks and fundamental problems with your approach.
The ability to contextualize current performance within historical patterns reduces the anxiety that comes from uncertainty. When you know how your portfolio has performed across various market conditions, you have a better sense of what to expect going forward.
Multi-period analysis also builds humility by showing you the role that luck plays in investment results. Even the best strategies have periods of underperformance, and even mediocre approaches can look brilliant during favorable market conditions. This understanding helps you avoid both overconfidence and despair.
Making time your ally
Professional investors have always understood that time is the most important dimension of investment analysis. Now individual investors can access the same multi-period analytical approaches that institutions use to evaluate their strategies and make improvements.
This means moving beyond the quarterly performance mindset that dominates so much investment thinking. Instead of asking "How did I do this quarter?" you start asking "How consistent is my approach across different market environments?" and "What patterns in my investment history can guide future decisions?"
The compounding effect of small improvements becomes visible when you analyze performance across multiple periods. Tiny adjustments to your asset allocation or investment selection process can create meaningful differences in long-term wealth accumulation, but these improvements only become apparent through multi-period analysis.
Your investment education accelerates when you can see the consequences of different strategies across various time horizons. Each market cycle teaches lessons that inform your approach to the next cycle, creating a feedback loop that continuously improves your investment results.
Ready to see your complete investment story?
Every investor has a multi-period story waiting to be discovered. Your investment history contains patterns and insights that can transform your approach to building wealth, but only if you have the tools to see them clearly.
Start your free trial and discover what multi-period analysis reveals about your investment journey.
The complete investment timeline solution
Understanding your investment performance across time requires tools designed for serious analysis. Our platform provides comprehensive multi-period tracking with the flexibility that sophisticated investors demand:
Flexible time period comparison
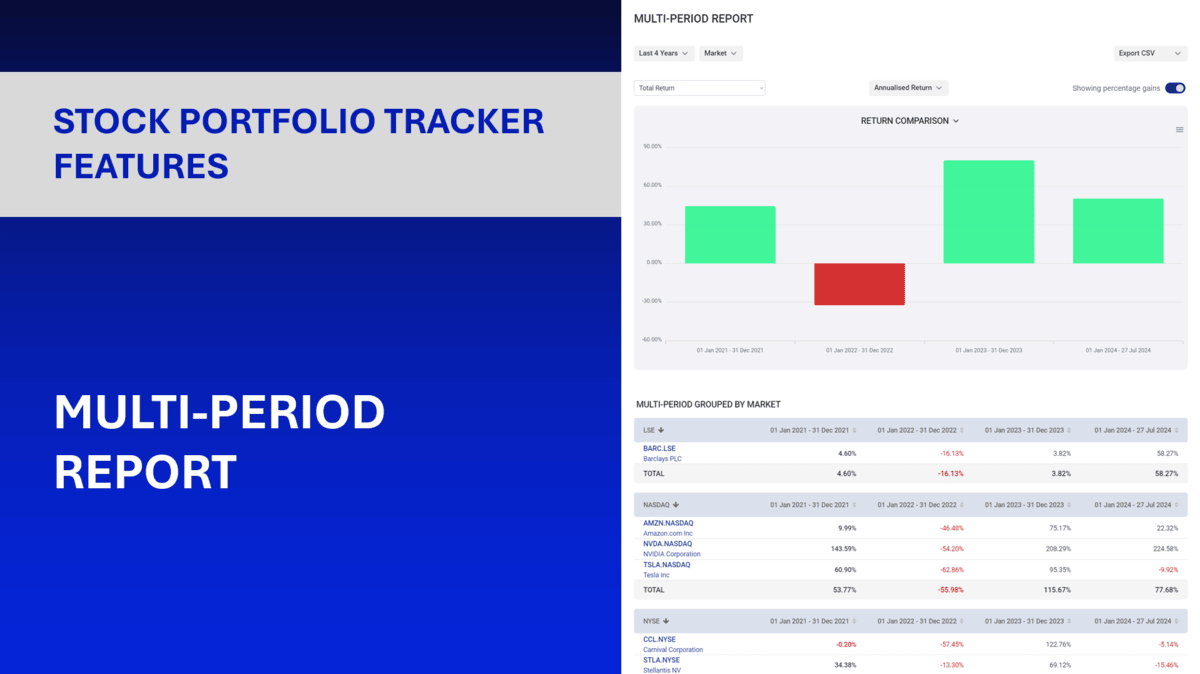
Analyze up to four different time periods simultaneously, with complete control over overlapping or distinct period selection, custom date ranges, and preset period options.
Comprehensive performance breakdown
See exactly where your returns come from across different time periods, with detailed analysis of capital gains, dividend income, currency effects, and total return components.
Advanced grouping and visualization
Organize your analysis by geography, sector, asset class, or any other criteria that matter to your strategy, with interactive charts that reveal patterns across time.
Professional-grade export capabilities
Take your multi-period data into other analytical tools or share insights with advisors through comprehensive CSV export functionality.
Create your account today and discover how multi-period analysis can transform your investment approach.
Disclaimer: The information provided in this article is for general informational purposes only and does not constitute specific advice, including but not limited to financial, investment, or legal advice. While we strive to ensure the accuracy and completeness of the information, we make no guarantees and assume no liability for any actions taken based on the content provided. Please consult with a qualified professional for advice tailored to your individual circumstances.