Why your 15% portfolio gains are actually a 5% loss
Discover the hidden truth about investment performance. Your impressive gains might actually be losses when compared to market benchmarks.

Adonia La Camera
Picture this: You're at a dinner party, and someone mentions their portfolio is up 15% this year. Impressive, right? But here's what they're not telling you, and what they probably don't even know themselves. During that same period, the market might have gained 20%. Their "success" is actually a 5% failure in disguise. Tools like Stock Portfolio Tracker can reveal these hidden performance gaps that most investors never discover.
This scenario plays out millions of times every day. Investors celebrate modest gains while missing the bigger picture entirely. They're winning small battles but losing the war, and they don't even realize it.
The uncomfortable truth? Most investors have no idea whether they're actually good at investing or just lucky enough to be in the market during an upward trend.
The dangerous illusion of investment success
Human psychology works against us when evaluating investment performance. We remember our wins, forget our losses, and completely ignore the most important question: compared to what?
This blind spot creates a false sense of security that can persist for years. You might feel confident about your investment skills while systematically underperforming simple index funds. You could be taking unnecessary risks, making poor allocation decisions, or missing obvious opportunities, all while believing you're on the right track.
The market doesn't care about your feelings or your effort. It only cares about results. And without proper comparison points, you're essentially investing with a blindfold on.
Consider the investor who proudly reports beating their target return of 8% by achieving 10% gains. Sounds great until you discover that a basic market index returned 15% during the same period. That "successful" strategy actually cost them 5% in opportunity losses, compounding over time into significant wealth destruction.
This isn't about perfect performance. It's about honest assessment. You can't improve what you can't measure accurately.
What happens when you start comparing honestly
Real investment education begins when you start measuring your results against appropriate standards. This process reveals patterns and truths that remain hidden when you're only looking at absolute returns.
Some investors discover they're taking excessive risk for mediocre rewards. Their portfolio might show decent returns, but when compared to lower-risk alternatives, the risk-adjusted performance tells a different story. They're working harder and worrying more for results they could achieve with less effort.
Others find that their stock-picking skills aren't adding value. Individual security selection might feel engaging and skillful, but comparison with broad market indices often reveals that all that research and analysis is producing inferior results. The time and energy spent on security selection could be better invested elsewhere.
Geographic and sector biases become apparent through comparative analysis. An investor heavily concentrated in domestic stocks might discover that international diversification would have improved both returns and risk management. Technology-focused portfolios might show impressive gains during tech booms but terrible risk-adjusted performance across full market cycles.
Timing decisions get exposed for what they really are. The investor who moved to cash during market volatility might feel smart about avoiding losses, but comparison with staying invested often reveals that market timing is much harder than it appears. Missing just a few of the best days can dramatically impact long-term results.
Cost awareness improves dramatically when you see how fees and expenses impact comparative performance. A portfolio that seems to be performing adequately might be significantly underperforming after accounting for the drag from high-cost investments and frequent trading.
The psychology of honest self-assessment
Facing reality about investment performance requires emotional maturity. It means accepting that your intuition might be wrong, your research might be inadequate, and your strategy might need fundamental changes.
This process is uncomfortable but liberating. Once you know where you actually stand, you can make rational decisions about how to improve. You might discover that your DIY approach isn't working and that professional management or simple index investing would serve you better. Or you might find that your strategy is sound but needs minor adjustments.
The ego blow of discovering underperformance is temporary. The financial benefit of accurate assessment compounds over decades. Every year you spend in denial is a year of suboptimal returns that you can never recover.
Honest benchmarking also provides emotional stability during market turbulence. When you know your strategy is working relative to appropriate comparisons, temporary losses become much easier to handle. You're not questioning your entire approach every time the market moves against you.
Building a framework for continuous improvement
Effective comparative analysis requires the right tools and methodology. You need to compare your results against relevant standards, across meaningful time periods, with proper accounting for risk and costs.
This means selecting benchmarks that actually relate to your investment approach. A portfolio of small-cap growth stocks shouldn't be compared to the broad market index. International investments need international benchmarks. Technology-focused strategies need technology-relevant comparisons.
Time period selection matters enormously. Short-term comparisons can be misleading due to randomness and market cycles. Long-term comparisons provide more meaningful insights but need to account for changing strategies and market conditions over time.
Risk adjustment transforms how you interpret results. A strategy that slightly underperforms the market but with much lower volatility might actually be superior on a risk-adjusted basis. Conversely, higher returns that come with dramatically increased risk might not be worth the trade-off.
Visual representation helps identify patterns that aren't obvious from numerical data alone. Seeing your performance plotted against benchmarks over time reveals periods where your strategy worked well and periods where it struggled. These insights guide strategic adjustments.
The analysis becomes a feedback loop that improves decision-making over time. Each comparison provides data that informs future choices. Market cycles become learning opportunities rather than just periods to endure.
From comparison to confidence
The goal isn't to beat every benchmark every time. It's to understand what's working, what isn't, and why. This understanding enables confident decision-making based on evidence rather than hope or fear.
Some investors discover that their active management is adding genuine value and should be continued or expanded. Others learn that simpler approaches would serve them better. Both discoveries are valuable because both lead to better outcomes.
Comparative analysis also reveals when underperformance is temporary and when it signals a fundamental problem. Every strategy goes through periods of relative weakness. The key is distinguishing between normal variation and systematic failure.
This framework supports better goal-setting and expectation management. When you understand what's realistically achievable given your risk tolerance and investment approach, you can set targets that are challenging but attainable.
The cost of continued ignorance
Every day you invest without proper comparative analysis is a day you might be making costly mistakes. These errors compound over time, turning small inefficiencies into large wealth destruction.
The opportunity cost isn't just financial. It's also the time and energy spent on strategies that aren't working, the stress of uncertainty about your progress, and the risk of making major changes at exactly the wrong time due to lack of proper perspective.
Professional investors understand this, which is why institutional portfolios are constantly measured against relevant benchmarks. Individual investors deserve the same level of analytical rigor for their financial futures.
Ready to discover where you really stand?
Professional-grade comparative analysis transforms how you think about investment success. When you can see exactly how your strategy performs against relevant alternatives, you gain the confidence that comes from real knowledge.
Start your free analysis and discover what honest benchmarking reveals about your investment approach.
Tools for serious investment analysis
Effective benchmarking requires sophisticated tools that can handle complex comparisons across multiple assets, time periods, and risk metrics:
Flexible benchmark selection
Compare your results against any investment vehicle, from broad market indices to specific securities, allowing for meaningful comparisons regardless of your strategy.
Comprehensive time period analysis
Examine performance across multiple timeframes to distinguish between short-term noise and long-term trends in your investment approach.
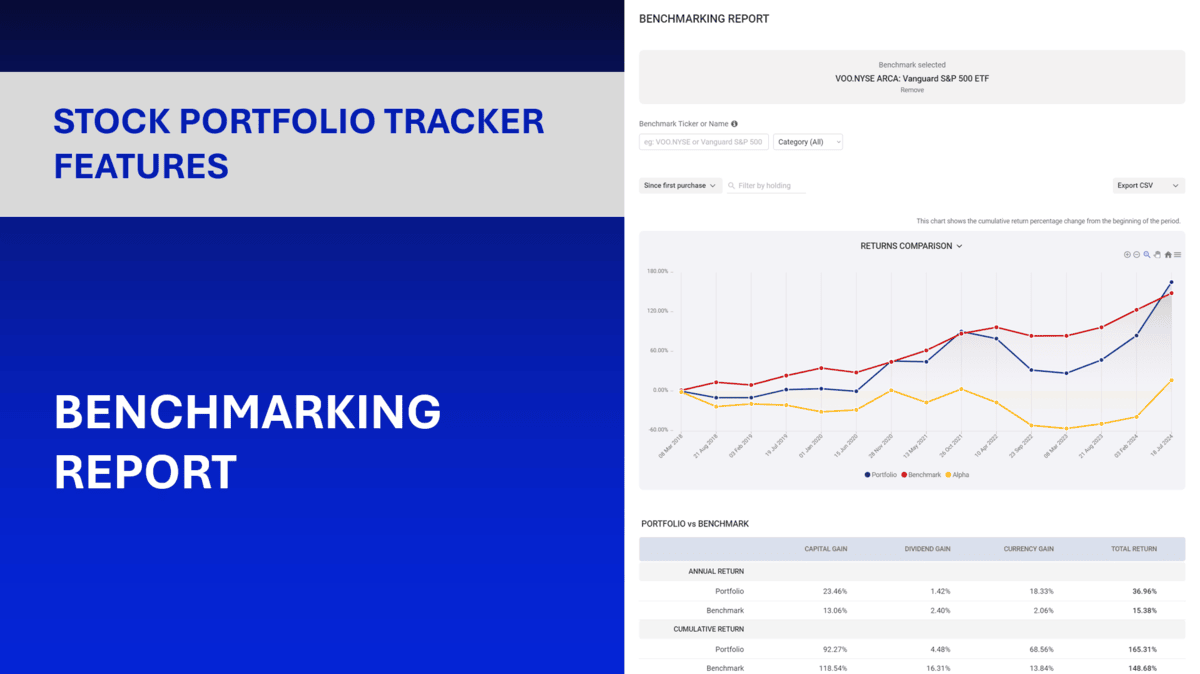
Visual performance tracking
Interactive charts reveal patterns in relative performance that numerical data alone cannot show, making it easier to understand when and why your strategy works.
Detailed return breakdown
Analyze the components of your performance versus benchmarks, including capital gains, dividend income, and currency effects for complete transparency.
Risk-adjusted metrics
Understand not just whether you're winning or losing, but how much risk you're taking to achieve your results.
Begin your comparison today and experience what happens when you finally have complete visibility into your investment performance relative to relevant alternatives.
Disclaimer: The information provided in this article is for general informational purposes only and does not constitute specific advice, including but not limited to financial, investment, or legal advice. While we strive to ensure the accuracy and completeness of the information, we make no guarantees and assume no liability for any actions taken based on the content provided. Please consult with a qualified professional for advice tailored to your individual circumstances.